
The Cardiac Cycle
The cardiac cycle is the sequence of electrical and mechanical events that occurs during one heartbeat — from the start of one contraction (systole), through relaxation and filling (diastole), to the start of the next. It is the mechanism by which the heart generates the pressure gradients, opening and closing the valves, which allows blood to move through the chambers and out into the systemic and pulmonary circulations.
Phases of the Cardiac Cycle
There are two main phases:
Diastole — relaxation and filling of the heart.
Systole — contraction and ejection of blood.
At a heart rate of 75 bpm the cardiac cycle lasts approximately 0.8 seconds. At rest, diastole occupies roughly two thirds of the cycle (~0.5 s) and systole roughly one third (~0.3 s).
Cycle duration is inversely proportional to heart rate. As rate increases — for example during exercise, sepsis or pain — the cycle shortens, and diastole shortens far more than systole.
Clinical relevance:
Because the left ventricle is perfused almost entirely during diastole, a shortening diastole reduces both ventricular filling and coronary blood flow at exactly the moment myocardial oxygen demand is rising.
Cycle Phases: The cycle includes atrial and ventricular diastole (relaxation) and systole (contraction).
At rest, diastole makes up about two thirds of the cycle, and systole about one third.
Durations below assume a heart rate of 75 bpm. Note that atrial systole is conventionally described first because it initiates the mechanical cycle, but it is in fact the final part of ventricular diastole — it is not an additional phase on top of filling.
1. Atrial systole (0.10 s)
Event: Atria contract, delivering the final 20–30% of ventricular filling (the “atrial kick”). The ventricles are now at end-diastolic volume.
AV valves (mitral, tricuspid): Open
Semilunar valves (aortic, pulmonary): Closed
Pressures: Atrial 4–6 mmHg · ventricular rises to ~5–10 mmHg · aortic ~80 mmHg (diastolic)
ECG: follows the P wave
Heart sound: S₄ if the ventricle is stiff (pathological in adults)
2. Isovolumetric ventricular contraction (0.05 s)
Event: Ventricles begin to contract. Pressure rises steeply but no blood moves — all four valves are shut.
AV valves: Close → first heart sound, S₁
Semilunar valves: Closed
Volume: Constant (hence “isovolumetric”)
Pressures: LV rises sharply ~10 → 80 mmHg · RV ~5 → 15 mmHg
ECG: immediately follows the QRS complex
3. Ventricular ejection (0.25 s)
Event: Once ventricular pressure exceeds aortic and pulmonary pressure the semilunar valves open and blood is ejected — rapidly at first (~0.15 s), then more slowly (~0.10 s).
AV valves: Closed
Semilunar valves: Open
Pressures: LV peaks ~120 mmHg · aortic peaks ~120 mmHg (= systolic BP) · RV ~25 mmHg · pulmonary artery ~25 mmHg
Volume: Falls from EDV (~120 mL) to ESV (~50 mL)
4. Isovolumetric ventricular relaxation (0.08 s)
Event: Ventricles relax; pressure falls rapidly. Again all valves are shut and volume is fixed.
Semilunar valves: Close → second heart sound, S₂
AV valves: Still closed
Pressures: LV falls ~100 → 5 mmHg. The aortic trace shows the dicrotic notch, the small rebound produced by aortic valve closure.
ECG: around the end of the T wave
5. Ventricular filling (0.32 s, plus atrial systole = 0.42 s total diastolic filling)
Rapid filling (~0.15 s): AV valves open and the ventricles fill quickly down the pressure gradient. S₃ arises here if present.
Diastasis (~0.17 s): Passive filling slows as atrial and ventricular pressures equalise. This is the phase that disappears first when heart rate rises.
Atrial systole (0.10 s): Tops the ventricles up — the cycle begins again.
Pressures: LV low, ~5–10 mmHg · LA slightly higher, ~7–8 mmHg · aortic falls gradually to ~80 mmHg (= diastolic BP)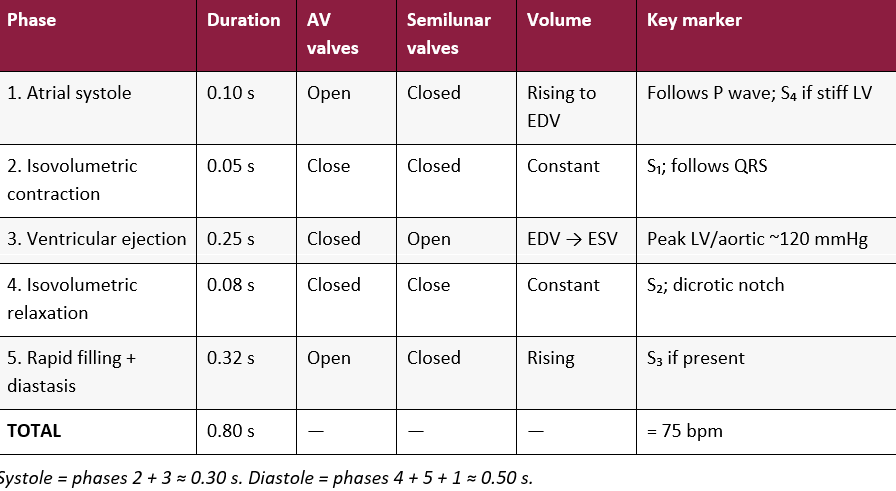
Volumes, stroke volume and cardiac output
The phases above generate the numbers you read off the monitor. Typical adult resting values: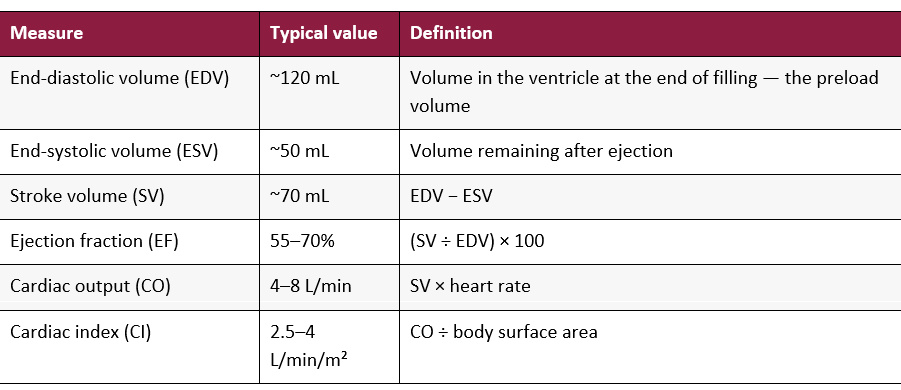
Anything that shortens filling time, reduces venous return, impairs contractility or raises afterload will change one of these variables — and the cardiac cycle explains where in the beat the problem sits. See also Starling’s Law and Cardiac Output Monitoring.
Heart sounds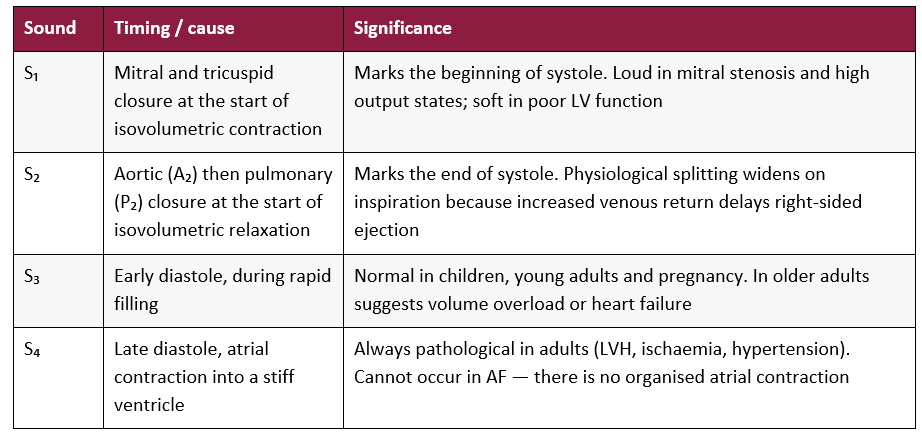
→ Link Heart Sounds (auscultation).
Correlating the cycle with the ECG
Electrical activity always precedes the mechanical event it triggers:
P wave → atrial depolarisation → atrial systole follows
QRS complex → ventricular depolarisation → isovolumetric contraction follows, and the AV valves shut (S₁)
T wave → ventricular repolarisation → relaxation follows, and the semilunar valves shut (S₂) at around the end of the T wave
The interval between the electrical and the mechanical event is the electromechanical delay. It is why pulseless electrical activity is possible: organised complexes on the monitor with no mechanical cycle behind them.
The cycle on the CVP / JVP waveform
Every deflection on a central venous trace maps onto a phase of the cycle: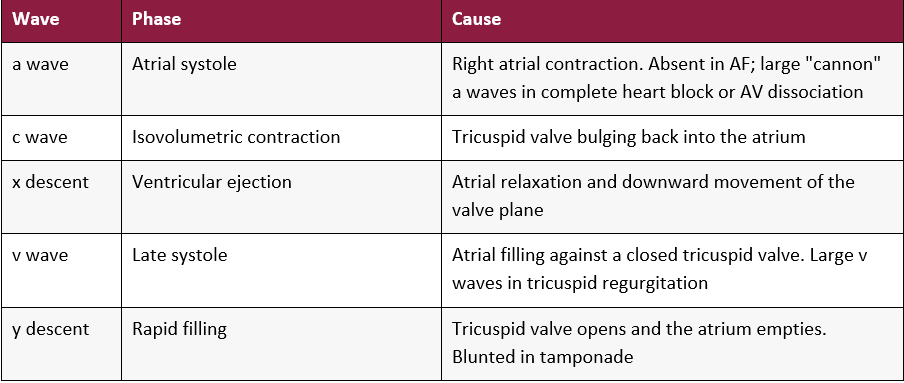 Electrical activity always precedes the mechanical event it triggers:
• P wave → atrial depolarisation → atrial systole follows
• QRS complex → ventricular depolarisation → isovolumetric contraction follows, and the AV valves shut (S₁)
• T wave → ventricular repolarisation → relaxation follows, and the semilunar valves shut (S₂) at around the end of the T wave
The interval between the electrical and the mechanical event is the electromechanical delay. It is why pulseless electrical activity is possible: organised complexes on the monitor with no mechanical cycle behind them.
The cycle on the CVP / JVP waveform
Every deflection on a central venous trace maps onto a phase of the cycle
“>
→ Link to Invasive Monitoring – Waveforms (Art, CVP, PA, PCWP).
Wigger’s diagram
The Wigger’s diagram aligns aortic, ventricular and atrial pressures, ventricular volume, the ECG and the heart sounds against a single cycle. Read it vertically: pick a moment in time and every trace tells you what is happening at that instant.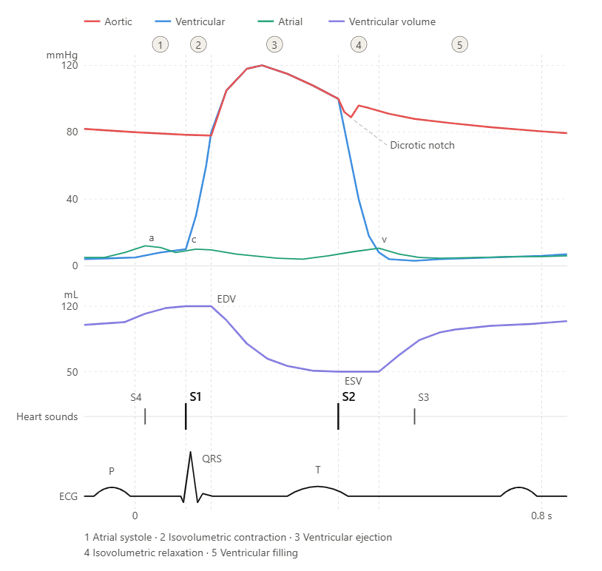
Clinical Note: Dicrotic Notch – sits exactly at the aortic/ventricular pressure crossover — which is what makes it a reliable marker for the end of systole on an arterial line.
Pressure–volume loop
The same cycle plotted as ventricular pressure against ventricular volume forms a loop with four sides, one per phase: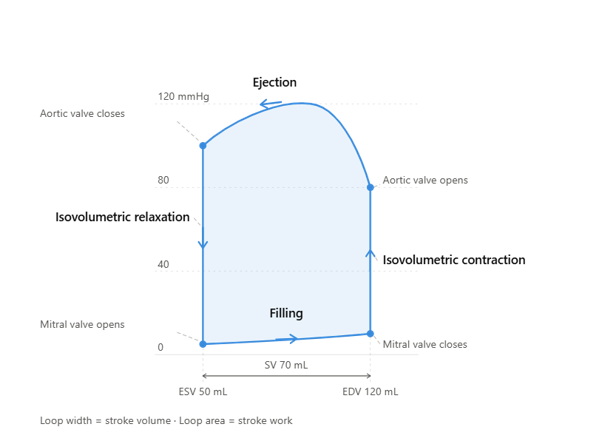
Filling (bottom, left to right) — volume rises at low pressure, ending at EDV
Isovolumetric contraction (right side, upward) — pressure rises, volume fixed
Ejection (top, right to left) — volume falls to ESV
Isovolumetric relaxation (left side, downward) — pressure falls, volume fixed
The width of the loop is stroke volume; the area inside it is stroke work.
Increasing preload widens the loop; increasing afterload raises and narrows it.
What it adds beyond the Wigger’s diagram:
Preload is the position of the bottom-right corner. Give more volume and the loop extends rightward.
Afterload is the height of the right-hand vertical side — the pressure the ventricle must exceed before the aortic valve will open.
Contractility determines the top-left corner. Better contractility empties the ventricle further, moving that corner left and widening the loop.
Stroke work is the enclosed area, which is why a ventricle working against high afterload costs more oxygen for the same stroke volume.
Typical Pressures (mmHg):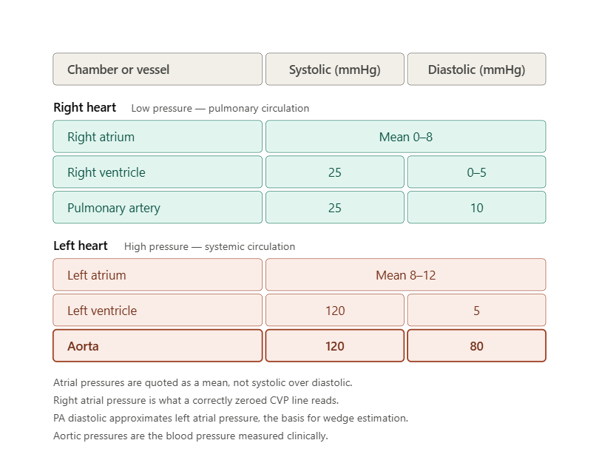
Key Concepts:
Pressure gradients open and close valves — valves are passive. Nothing in the cycle is actively opened.
Isovolumetric phases have all four valves closed — pressure changes, volume does not.
Left-sided pressures greatly exceed right-sided pressures — systemic vascular resistance is far higher than pulmonary. The sequence of events is identical on both sides; only the numbers differ.
Right-sided events lag slightly behind left-sided events — which is why S₂ splits.
Diastole is the vulnerable phase — it shortens first as rate rises, and it is when the LV both fills and perfuses itself.
Cycle duration shortens with faster heart rates (mainly diastole shortens).
Why this matters at the bedside:
Tachycardia and coronary perfusion
Coronary perfusion pressure ≈ aortic diastolic pressure − LV end-diastolic pressure, and left coronary flow occurs almost entirely in diastole. A patient in fast AF at 160 bpm has lost most of their diastolic time: reduced filling, reduced stroke volume, and reduced coronary flow, while demand is high. This is why rate control is treatment, not just cosmetics. See Coronary Artery Anatomy and Management of Cardiac Arrhythmias.
Loss of the atrial kick
Atrial systole contributes 20–30% of filling in a healthy heart, but considerably more when the ventricle is stiff. Patients with LVH, HOCM, aortic stenosis or diastolic dysfunction may decompensate dramatically on entering AF, because they were relying on that contribution. This is also the argument for maintaining AV synchrony when selecting a pacing mode.
Pacing and AV synchrony
A dual-chamber mode preserves the timed relationship between atrial and ventricular contraction. Ventricular pacing alone loses it, and the resulting drop in stroke volume — with atrial contraction occurring against closed AV valves — is the basis of pacemaker syndrome. See Principles of Cardiac Pacing and Epicardial Pacing following Cardiac Surgery.
Reading the arterial trace
The upstroke is ejection; the dicrotic notch is aortic valve closure and therefore the end of systole; the decay that follows is diastolic runoff. A damped trace, a slurred notch or an exaggerated respiratory swing all become interpretable once you know which part of the cycle you are looking at. See Arterial Line Transducer.
Obstructed filling and ejection
Cardiac tamponade — external pressure restricts diastolic filling; the y descent is blunted
Mitral stenosis — obstructs filling; poorly tolerated when tachycardia shortens diastole
Aortic stenosis — obstructs ejection; the LV generates a large pressure gradient across the valve during phase 3
Heart failure with preserved ejection fraction — a stiff ventricle fills poorly despite normal contraction
Related pages
Foundations
Structure and Function of the Heart
Heart Valves
Cardiac Conduction System
Cardiac Action Potential
Starling’s Law
Cardiac v Skeletal Muscle
Coronary Artery Anatomy
Applying it at the bedside
Heart Sounds (auscultation)
Invasive Monitoring – Waveforms – Art, CVP, PA, PCWP
Arterial Line Transducer
Cardiac Output Monitoring
Cardiac Output Studies – reference ranges and examples
Normal observation values
12 lead ECG Essentials
When the cycle goes wrong
Pathophysiology of Heart Failure
Left Ventricular Failure
Acquired Heart Valve Disease – overview
Cardiac Tamponade
Hypertrophic (Obstructive) Cardiomyopathy (HOCM)
Management of Cardiac Arrhythmias
Principles of Cardiac Pacing
Cardiogenic Shock
Further reading
Levick, An Introduction to Cardiovascular Physiology — the standard readable undergraduate text.
BJA Education — short peer-reviewed reviews on cardiovascular physiology and monitoring.
Marino, The ICU Book, or Bersten & Handy, Oh’s Intensive Care Manual — for haemodynamic application in critical care.
STEP COMPETENCY LINK
→ Link to Step 1 ICU Pathway page.
Page last reviewed: July 2026 · AskAlth Nursing team, London, UK, Next review due: July 2027