Waveforms: what are you looking at?
1. Before you interpret anything: is the trace trustworthy?
A waveform is only as good as the system that produced it. Three checks come before interpretation, every shift and after every position change.
Levelling
The transducer must sit at the phlebostatic axis — the intersection of the 4th intercostal space and the mid-axillary line, which approximates the level of the right atrium.
Transducer position
Too high (above the axis), Reads falsely low
Too low (below the axis), Reads falsely high
Roughly 7.5 mmHg per 10 cm of vertical error.
A transducer taped to a drip stand while the bed is dropped for a procedure can easily be 20 cm out — enough to turn a MAP of 65 into a MAP of 80.
For a patient nursed head-up, level to the phlebostatic axis in that position; don’t lie the patient flat purely to measure, but do record the position you measured in so the next nurse compares like with like.
Zeroing
Switch the three way tap to be off to the patient; Open the transducer to atmosphere (‘Off to Patient; Open to Air’) then press zero on the monitor that atmospheric pressure = 0.
This removes barometric pressure from the reading so what you see is pressure relative to atmosphere. Zero at the start of a shift, after any patient movement, and whenever a value doesn’t fit the patient.
Levelling and zeroing are different jobs.
Zeroing corrects for atmospheric pressure; levelling corrects for hydrostatic column height. Doing one does not fix the other.
Dynamic response — the square wave (fast-flush) test
Pull or squeeze the flush device for about a second and release. The trace shoots to the top of the scale, then snaps back. What happens on release tells you about the system.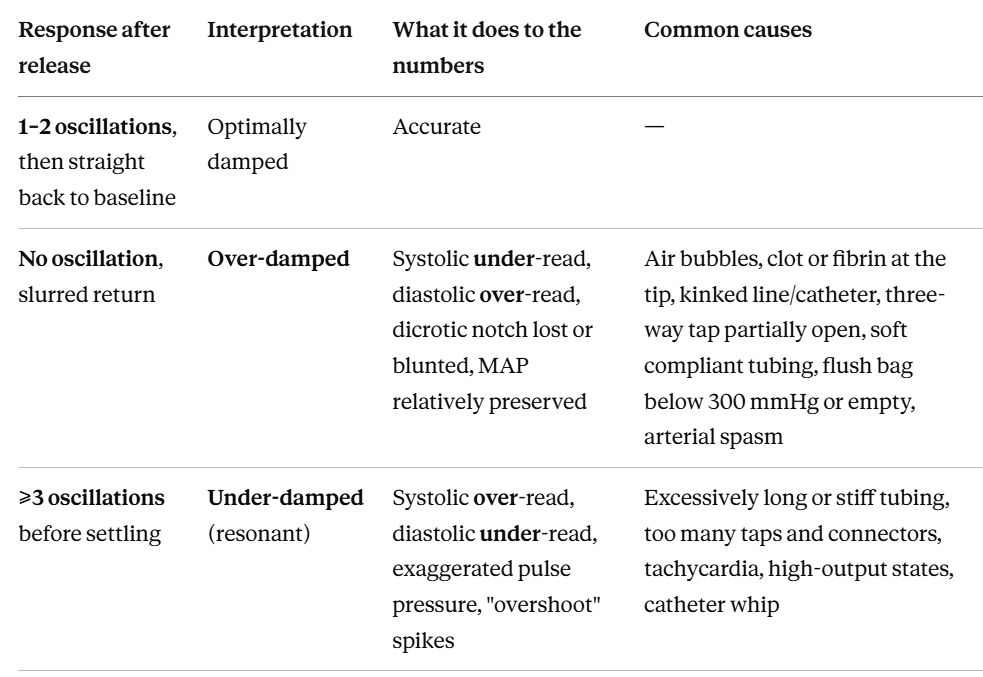
Practical rule: if MAP and the clinical picture agree but systolic looks odd, suspect a damping problem. In an over-damped system, MAP remains the most reliable number — which is one reason MAP, not systolic, drives most ICU haemodynamic targets.
2. The arterial pressure waveform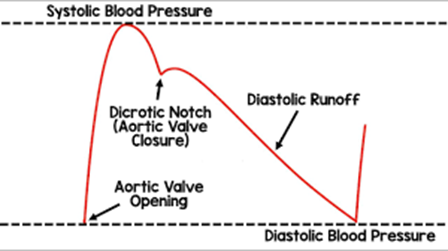
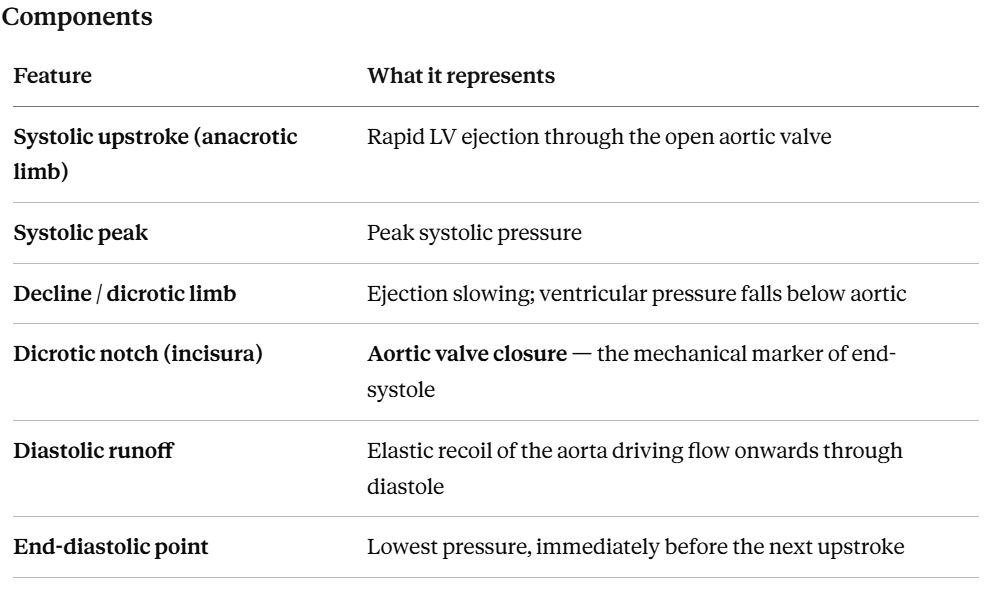
Area under the curve (systolic portion) ≈ stroke volume. This is the principle behind pulse contour analysis (PiCCO, LiDCO, FloTrac).
Note — Cardiac output = stroke volume × heart rate, in litres/min
Slope of the upstroke reflects the rate of pressure development (dP/dt) and so, loosely, contractility. A slurred, sloping upstroke is seen in poor LV function and in severe aortic stenosis.
Position of the dicrotic notch relates to systemic vascular resistance. High SVR (cold, vasoconstricted, hypovolaemic) → notch sits high on the downstroke. Low SVR (sepsis, vasoplegia, liver failure) → notch sits low, with a wide pulse pressure and a rapid runoff.
Pulse pressure (systolic − diastolic) narrows in hypovolaemia, tamponade and low stroke volume; widens in aortic regurgitation, sepsis, and stiff arteries in the elderly.
Site matters — distal pulse amplification
The further from the aorta, the more the waveform changes:
Systolic pressure rises (a dorsalis pedis systolic can be 20–30 mmHg above aortic root)
Diastolic pressure falls
The dicrotic notch appears later and more damped
MAP stays roughly constant across sites
Another argument for using MAP when comparing a femoral line with a previous radial line.
Respiratory swing: pulse pressure and stroke volume variation
In a mechanically ventilated patient, positive pressure breaths cyclically alter venous return and so alter stroke volume.
A swinging arterial trace with the ventilator suggests the patient may be fluid-responsive (underfilled and may benefit from a fluid challenge). Quantified as pulse pressure variation (PPV) or stroke volume variation (SVV), values above roughly 13% suggest fluid responsiveness.
PPV/SVV are only valid when all of the following hold:
Fully mechanically ventilated with no spontaneous effort
Tidal volume ≥ 8 ml/kg predicted body weight
Sinus rhythm (AF invalidates it)
Closed chest and closed abdomen
No significant right ventricular failure
Because lung-protective ventilation uses 6 ml/kg, PPV is invalid in a great many ICU patients. A passive leg raise with a stroke volume monitor is often the more useful test (if blood pressure goes up when legs are raised it is likely the patient will be fluid responsive)
Common artefacts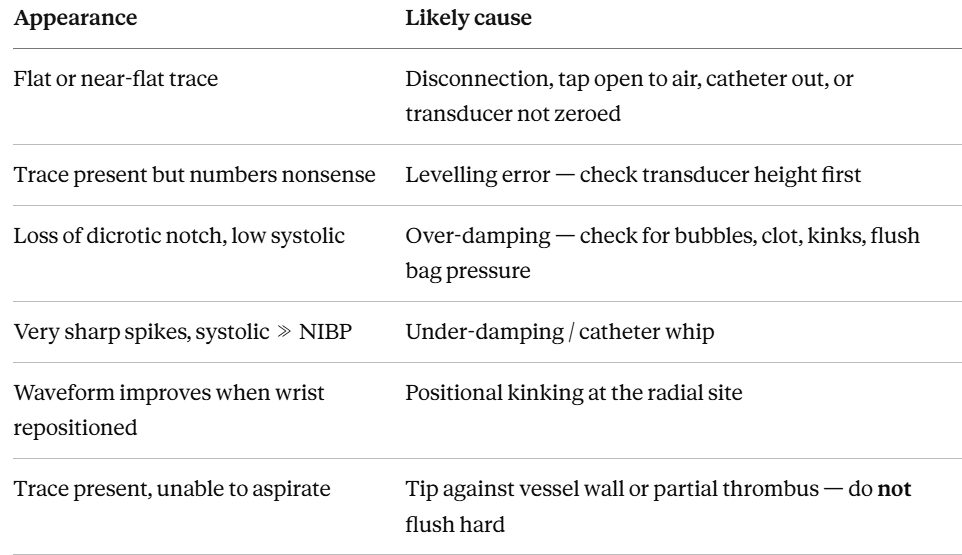
Safety note: never flush an arterial line vigorously against resistance. Retrograde embolisation of clot or air toward the cerebral circulation is a recognised, if rare, complication. Flush volumes should be small.
3. Central venous pressure (CVP) waveform
CVP is right atrial pressure, and — with a normal tricuspid valve — approximates right ventricular end-diastolic pressure.
Normal: 2–8 mmHg (some units quote 0–8, or 3–10 cmH₂O; confirm the units your monitor is displaying — 1 mmHg ≈ 1.36 cmH₂O).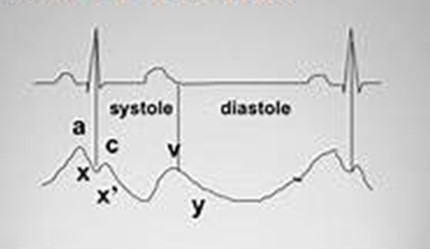
The waves and descents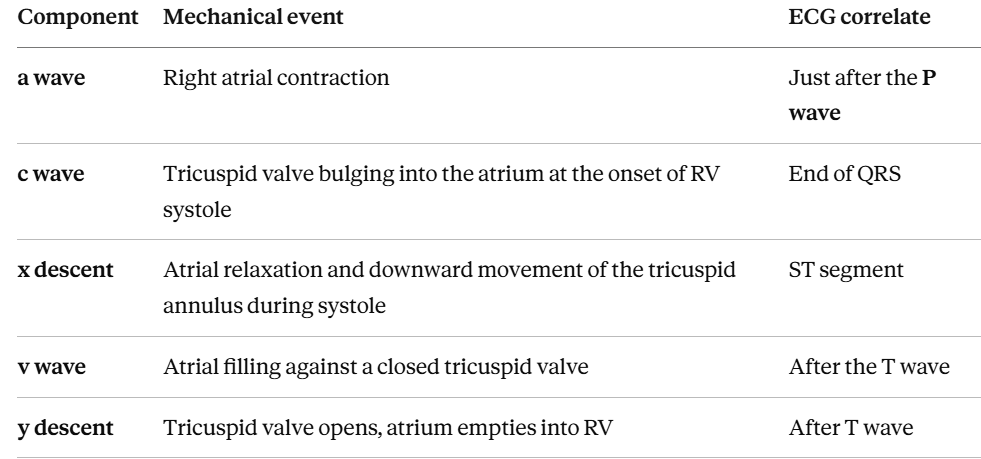
Memory aid: a for atrial contraction, c for closure of the tricuspid valve, v for ventricular systole filling the atrium.
Reading it correctly
Read at end-expiration, when intrathoracic pressure is closest to atmospheric — in both spontaneously breathing and ventilated patients. In spontaneous breathing this is the highest point of the respiratory excursion; in positive pressure ventilation it is the lowest.
Use the digital number with caution and always cross-check the waveform. Monitors averaging over the respiratory cycle produce misleading values.
Measure at the base of the c wave (or the mean of the a wave) for the value closest to RV end-diastolic pressure.
High PEEP transmits into the thorax and falsely elevates CVP.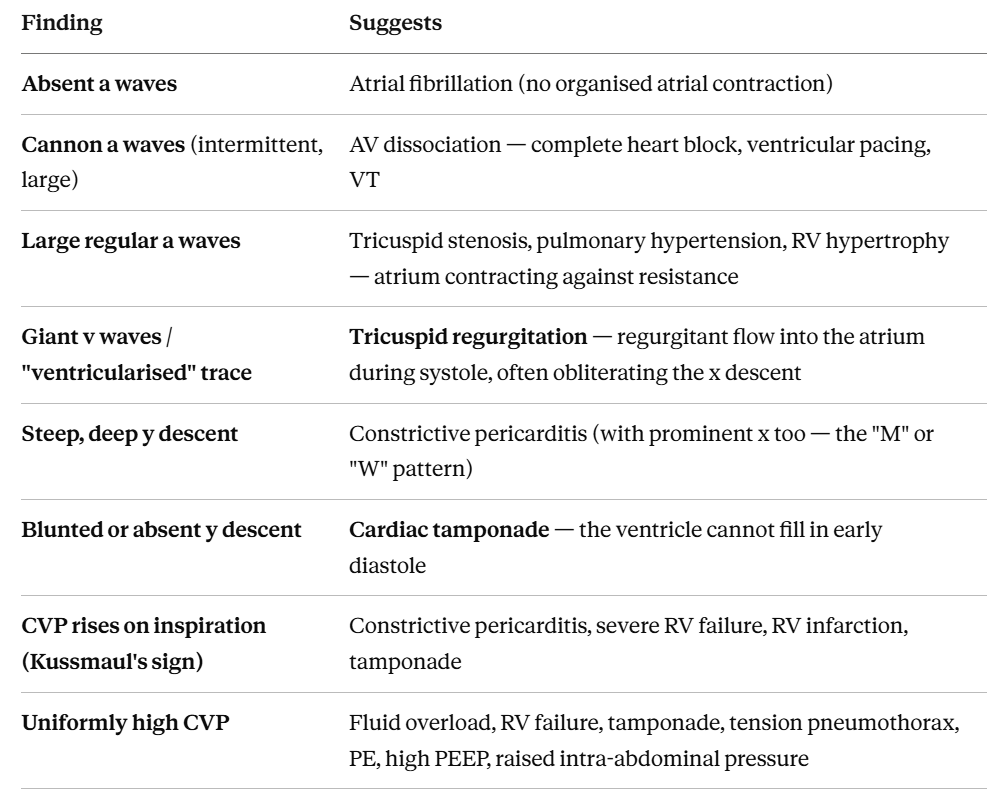
The important caveat about CVP
A single CVP value is a poor predictor of fluid responsiveness. Systematic reviews have repeatedly shown that CVP discriminates fluid responders from non-responders little better than chance. It has largely been abandoned as a resuscitation target in sepsis guidance.
CVP remains useful for:
Trends in a given patient with an unchanged clinical context
Recognising very high or very low values (a CVP of 1 or 22 does carry information)
Waveform diagnosis (the patterns above)
Estimating the pressure opposing venous return, and as a component of perfusion pressure calculations
It is not useful as a number to titrate fluids to.
Teach the waveform; be honest about the number.
4. Pulmonary artery catheter and the PA waveform
The PA catheter (Swan-Ganz) is a balloon-tipped, flow-directed catheter passed from a central vein through the right heart into a branch pulmonary artery.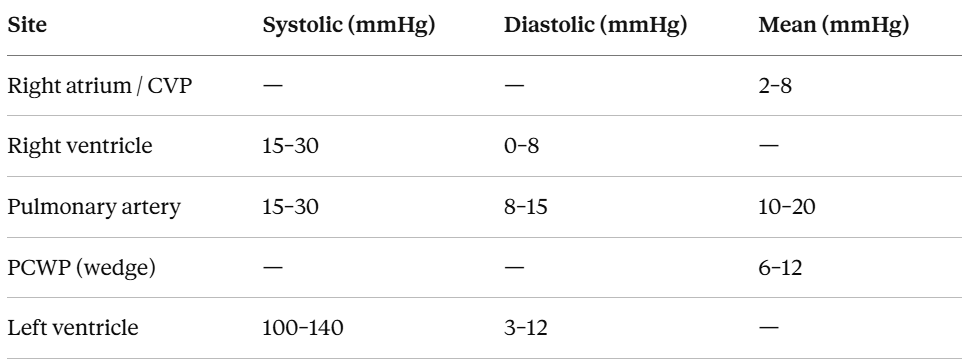
Floating the catheter — the waveform sequence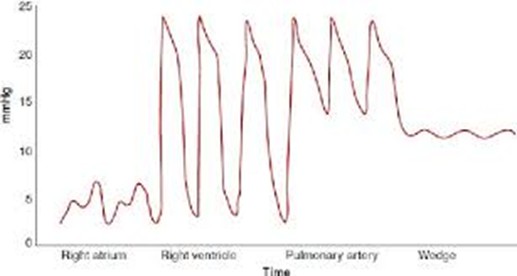
1. Right atrium (~15–20 cm) — low amplitude, a/c/v waves, mean 2–8. Balloon is inflated here, once the tip is confirmed in the RA.
2. Right ventricle (~30–35 cm) — abrupt jump in systolic pressure to 15–30, with a diastolic pressure near zero. Diastole slopes gently upward as the ventricle fills. This is the arrhythmia-prone zone: have the defibrillator and anti-arrhythmics available.
3. Pulmonary artery (~40–45 cm) — the two changes that confirm the transition:
Diastolic pressure steps up (from ~0 to ~8–15) because the pulmonary valve closes and pressure is maintained by the vascular bed
A dicrotic notch appears (pulmonary valve closure)
Systolic pressure is essentially unchanged from RV
Diastole now slopes downward
4. Wedge / PCWP (~45–55 cm) — the tall PA trace collapses into a low-amplitude venous-looking trace with a and v waves, mean 6–12, always lower than PA diastolic.
Distances are from a right internal jugular insertion; add roughly 10 cm from the left IJ or a femoral approach.
PCWP — what it actually measures
With the balloon inflated, a static column of blood connects the catheter tip through the pulmonary capillary bed to the pulmonary veins and left atrium. The tip therefore “sees”:
PCWP ≈ left atrial pressure ≈ LV end-diastolic pressure ≈ LV preload
This chain of approximations breaks down when:
Mitral stenosis or mitral regurgitation — PCWP overestimates LVEDP (giant v waves in MR)
Poor LV compliance (LVH, ischaemia, tamponade) — a given pressure reflects a smaller volume
High PEEP — alveolar pressure is transmitted to the capillaries
The tip is not in West zone 3 (where pulmonary arterial > venous > alveolar pressure). Above the level of the left atrium, the catheter may be measuring alveolar pressure instead. In the supine patient most of the lung is zone 3, which is why wedge readings are and should be taken supine.
Tachycardia shortens diastole and impairs equilibration
Aortic regurgitation — the LV pressurises early; PCWP under-reads LVEDP
Because PA diastolic pressure normally approximates PCWP (within ~1–4 mmHg) in the absence of pulmonary hypertension, many units follow PADP and wedge only when needed — reducing balloon inflations and therefore risk.
Wedge waveform abnormalities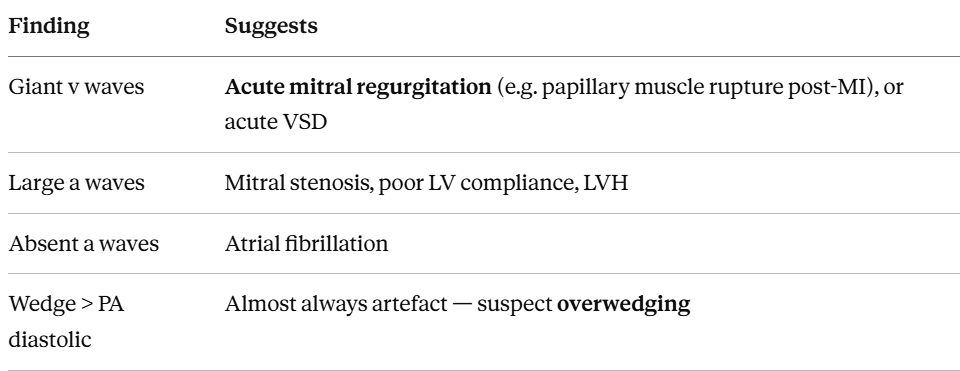
5. PA catheter safety
Do not use a PA catheter unless trained to do so. In untrained hands they are very dangerous to the patient.
Balloon
This is a closed system which Inflates with air only, never fluid or CO₂ (unless a documented intracardiac shunt, where CO₂ is preferred).
Maximum 1.5 ml. Use the syringe supplied; it is volume-limited for this reason.
Inflate slowly and stop the moment the waveform wedges. If it wedges on less than 1.5 ml, the catheter has migrated too distally — withdraw.
Never advance the catheter with the balloon deflated. Never withdraw it with the balloon inflated.
Deflate passively — let the syringe fill itself; don’t aspirate hard, which can damage the balloon.
Limit wedging to two respiratory cycles / ~15 seconds, and no more often than genuinely necessary.
Overwedging — the trace rises progressively and doesn’t plateau, often exceeding PA diastolic. It means the balloon is occluding against the vessel wall or is over-inflated. Deflate immediately.
Continuous PA trace monitoring is mandatory.
A wedge tracing appearing spontaneously with the balloon deflated means the catheter has migrated distally — this is a pre-rupture warning. Deflate, alert medical staff, arrange withdrawal and a chest X-ray.
Complications to know
Arrhythmias during insertion (usually self-limiting VE/VT) as they occur as the catheter is being ‘floated’ through the heart, and RBBB — which causes complete heart block if the patient already has existing LBBB
Pulmonary artery rupture — rare but with high mortality. Risk factors: pulmonary hypertension, age, anticoagulation, distal migration, over-inflation. Presents as sudden haemoptysis.
Pulmonary infarction from persistent wedging
Knotting, looping, valve or chordal damage
Thrombosis, catheter-related bloodstream infection
Balloon rupture (loss of resistance, no wedge obtained, and possible air embolism) — stop, label the lumen “do not inflate”, inform medical staff
Is the PAC still used?
Use has fallen substantially since trials including PAC-Man (2005) and ESCAPE (2005) showed no mortality benefit in general ICU and heart failure populations, alongside the growth of echocardiography and less invasive cardiac output monitoring.
It retains a place in:
– Cardiac surgery and cardiogenic shock, particularly RV failure
– Pulmonary hypertension — diagnosis and vasodilator testing
– Assessment for transplantation and mechanical circulatory support
– Complex shock where the mechanism is genuinely unclear
The consistent lesson from the trials is that a monitor doesn’t improve outcomes on its own — the interpretation and the response to it do.
That’s the case for knowing these waveforms properly.
6. Putting it together: classic haemodynamic patterns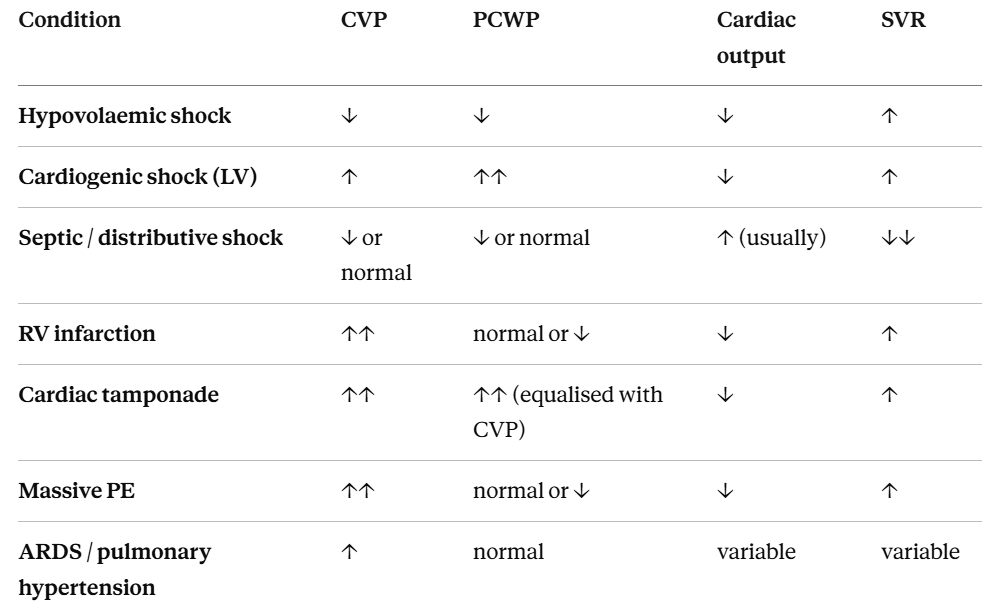
The tamponade row is worth memorising: equalisation of diastolic pressures across all chambers plus a blunted y descent is close to diagnostic.
Reading list:
Elsewhere on AskAlth
Foundations — read these first
The Cardiac Cycle — essential context for every wave described above
Structure and Function of the Heart
Heart Valves — valve opening and closure generate the notches and descents
Starling’s Law — why we care about preload at all
Normal observation values
Directly related monitoring pages
Arterial Lines – Overview
Arterial Line Transducer — levelling and zeroing in detail
Arterial Line Insertion – equipment and procedure
Arterial Line Removal
Central Line Insertion
Central line – hazards and complications
Central Line Removal
Cardiac Output Monitoring
Cardiac Output Studies – reference range and examples
Cardiac Monitoring – Set Up
Heart Sounds (auscultation) — S1/S2 map directly onto the c wave and dicrotic notch
Applying the waveforms
Cardiogenic Shock
Cardiac Tamponade
Left Ventricular Failure
Pathophysiology of Heart Failure
Pulmonary Embolism (PE)
Cor Pulmonale
Myocardial Infarction / Acute Coronary Syndrome
Fluid Management – Colloid v Crystalloid
Monitoring Fluid Status, Balance and Renal Function
Common Cardiac Drugs — vasopressors and inotropes change waveform morphology
Acquired Heart Valve Disease — for the MR and TR waveform patterns
ARDS — PEEP and its effect on transmitted pressures
Free online resources
CV Physiology (Richard Klabunde) — clear, diagram-led explanations of the cardiac cycle, pressure-volume loops and vascular function curves. cvphysiology.com
BJA Education (formerly Continuing Education in Anaesthesia, Critical Care & Pain) — concise peer-reviewed review articles; search for arterial pressure waveform analysis, cardiac output monitoring, and pulmonary artery catheterisation. Free to read via the journal site.
Epic3 / NICE guidance on vascular access infection prevention — for the care-bundle side of invasive lines.
NICE MTG3, cardiac output monitoring (CardioQ-ODM) — useful UK context for why oesophageal Doppler is favoured in some settings.
Textbooks
Core, and best value for a UK critical care nurse
Marino, The ICU Book / Marino’s The Little ICU Book — the chapters on arterial pressure, central venous pressure and the pulmonary artery catheter are excellent
Oh’s Intensive Care Manual (Bersten & Handy) — the standard UK/Australasian reference; strong haemodynamic monitoring section.
Adam, Osborne & Welch, Critical Care Nursing: Science and Practice (Oxford) — written for the UK nursing audience and pitched exactly at this level.
Woodrow, Intensive Care Nursing: A Framework for Practice — accessible, UK-focused, good on the nursing responsibilities around invasive lines.
Physiology underpinning
Pappano & Wier, Cardiovascular Physiology (Mosby Physiology series) — for the cardiac cycle and pressure-volume relationships.
Klabunde, Cardiovascular Physiology Concepts — the book version of the website; short and very readable.
Levick, An Introduction to Cardiovascular Physiology — more detailed, excellent on venous return and the Guyton curves that explain why CVP behaves as it does.
Deeper / reference:
Hall & Schmidt, Principles of Critical Care (Hall, Schmidt & Kress) — thorough chapters on shock states and haemodynamic interpretation.
Magder — his review papers on central venous pressure and its misinterpretation are the standard citations for the “CVP doesn’t predict fluid responsiveness” point.
Marik & Cavallazzi, Does the central venous pressure predict fluid responsiveness? An updated meta-analysis (Critical Care Medicine, 2013) — the paper behind the caveat in section 3.
Harvey et al., PAC-Man trial (Lancet, 2005) and Binanay et al., ESCAPE trial (JAMA, 2005) — the two studies that changed PA catheter practice.
Waveform atlases:
Darovic, Hemodynamic Monitoring: Invasive and Noninvasive Clinical Application — out of print but the classic waveform atlas; worth finding secondhand or in a hospital library.
Mark, Atlas of Cardiovascular Monitoring — comprehensive and heavily illustrated; the reference for unusual waveform patterns.
Last clinically reviewed: July 2026, AskAlth Nurses, London UK · Next review due: July 2028
A note on scope
Everything above is teaching content, not a local protocol. Balloon inflation volumes, wedging frequency, flush pressures and transducer change intervals must follow your own unit’s policy and the manufacturer’s instructions for the device in use.