

Starling’s Law of the Heart
How to use this resource, and learning outcomes:
1. Why Starling’s law matters at the bedside
2. The law itself
3. The mechanism
4. The Frank–Starling curve
5. Preload, afterload and contractility
6. What actually determines preload in your patient
7. The family of curves: how the curve moves
8. Fluid responsiveness: where is my patient on the curve?
9. Why CVP is a poor measure of preload
10. The right ventricle and ventricular interdependence
11. Clinical scenarios
12. Clinical implications for the acute care nurse
Abbreviations
13. Self-test
Glossary
Recommended pages
Further reading and local governance
How to use this resource
Sections 2 to 5 build the physiology. Sections 6 to 12 apply it to the question you will actually be asked on a ward round: should this patient have more fluid, and how would you know?
ICU Step Competencies:
If you are working through Step 1, sections 2 to 7, 11 and 12 are your priority.
If you are working through Step 2 or an academic critical care programme, sections 8 to 10 are where the rationale sits — fluid responsiveness, the limitations of CVP, and ventricular interdependence.
Learning outcomes
Step 1 — by the end of this session you will be able to:
– State Starling’s law and describe the mechanism behind it.
– Draw and label the Frank–Starling curve, and explain what happens at each end of it.
– Define preload, afterload and contractility and state how each affects stroke volume.
– Write the relationships linking heart rate, stroke volume, cardiac output, systemic vascular resistance and blood pressure.
– Explain why a patient with heart failure tolerates both hypovolaemia and fluid overload less well than a healthy person.
– List the factors that reduce preload in a ventilated critically ill patient.
Step 2 — in addition, you will be able to:
– Explain what fluid responsiveness means, and describe how it is assessed at the bedside.
– State the conditions required for stroke volume variation and pulse pressure variation to be valid, and identify when they are not.
– Give a rationale for why a passive leg raise is often preferred in the patients you look after.
– Explain why a single CVP reading is a poor guide to filling, and what you would use instead.
– Explain ventricular interdependence and why more fluid can lower cardiac output in right ventricular failure.
– Distinguish between a patient who is fluid responsive and a patient who needs fluid.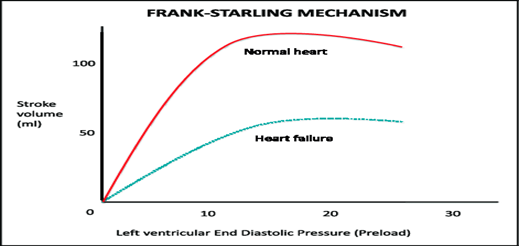
Frank–Starling curve — stroke volume against preload, with the steep and flat portions labelled, and a family of curves showing the normal heart and the failing heart
1. Why Starling’s law matters at the bedside
This is the physiology behind the most frequently asked question in critical care: “shall we give some more fluid?” Starling’s law is what determines whether the answer is yes, and where on the curve a patient sits is what determines whether that fluid helps or harms.
It explains why the same intervention has opposite effects in different patients. A 250 mL bolus in a hypovolaemic patient on the steep part of the curve produces a useful rise in stroke volume. The identical bolus in a patient on the flat part produces no rise in output at all — only a rise in filling pressure, pulmonary congestion and oedema.
It also explains the automatic behaviour of the heart. The two ventricles must eject the same volume over time, and Starling’s law is the mechanism that keeps them matched without any nervous or hormonal signal.
2. The law itself
Starling’s law — also known as the Frank–Starling law of the heart — describes how the heart automatically adjusts its pumping force in response to changes in the volume of blood returning to it.
The law states that:
Stroke volume increases in response to an increase in the volume of blood in the ventricles before contraction — the end-diastolic volume, or preload — when all other factors remain constant.
In simpler terms:
The more the cardiac muscle fibre is stretched during filling (diastole),
the greater the force of contraction during systole,
and the more blood is ejected with each heartbeat —
up to a physiological limit.
That final line is the one that matters clinically. The relationship is not limitless, and most of the harm done with fluid in critical care is done past that limit.
3. The mechanism
When more blood returns to the heart, the ventricular walls stretch. That stretch changes the muscle at sarcomere level in three ways:
(i) Improved filament overlap — actin and myosin are brought into a more favourable alignment for cross-bridge formation.
(ii) Increased calcium sensitivity — this is the dominant mechanism. Stretching the sarcomere increases the sensitivity of troponin C to calcium, so the same amount of calcium released during phase 2 of the action potential produces a stronger contraction. This is known as length-dependent activation.
(iii) Reduced lattice spacing — stretching narrows the distance between the filaments, bringing the myosin heads closer to their binding sites.
The result is a stronger contraction and a greater stroke volume.
Cross-link: the calcium released during phase 2 is described on the Cardiac Action Potential page. It is worth reading the two together — Starling’s law changes how much work the heart gets out of a given amount of calcium, while inotropes change how much calcium there is. Levosimendan is interesting precisely because it works on the sensitivity side rather than the calcium side.
The relationships you need:
Cardiac output = heart rate × stroke volume
Mean arterial pressure ≈ cardiac output × systemic vascular resistance
Stroke volume is determined by preload, afterload and contractility
Together these are the determinants of cardiac output and of blood pressure.
For normal values, see Cardiac Output Studies – reference range and examples.
4. The Frank–Starling curve
Plotting stroke volume against preload produces the Frank–Starling curve.
The steep portion. At low filling volumes the curve rises steeply. A small increase in preload produces a large increase in stroke volume. A patient here is fluid responsive — fluid will help.
The flat portion. Beyond a certain point the curve flattens. Additional filling produces little or no further increase in stroke volume, but it does raise filling pressures. A patient here is not fluid responsive — fluid will produce congestion and oedema without improving output.
A note on the ‘descending limb’
Older diagrams show the curve turning downward at high filling volumes, implying that the sarcomeres are overstretched.
In the intact human heart this descending limb is not really seen — the curve plateaus rather than falls. Deterioration at high filling volumes is caused by pulmonary and systemic congestion, pericardial constraint, ventricular interdependence and functional mitral or tricuspid regurgitation from annular dilatation, rather than by sarcomeres being pulled too far apart.
The practical message is the same, and it is worth being precise about the reason: over-filling harms your patient through congestion and ventricular interaction, not through overstretched muscle.
5. Preload, afterload and contractility
Starling’s law describes only one of the three determinants of stroke volume. All three need to be considered together, because in sick patients they rarely change one at a time.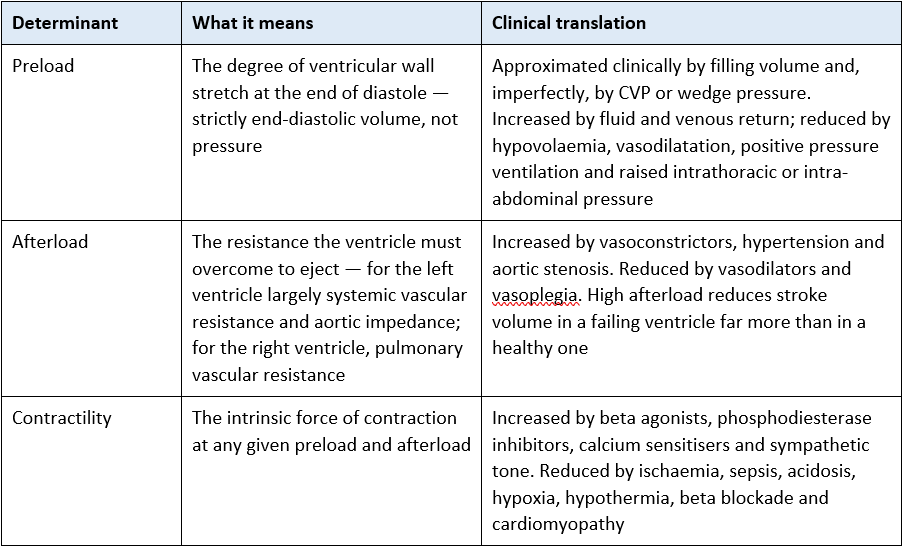
The distinction that trips people up: preload moves the patient along the curve. Contractility and afterload move the patient onto a different curve. That is the subject of section 7.
6. What actually determines preload in your patient
Preload is not simply “how much fluid they have had”. In a ventilated critically ill patient, several things reduce ventricular filling at once.
Circulating volume — haemorrhage, diarrhoea and vomiting, polyuria, insensible losses, third-space losses and inadequate replacement.
Venous tone — most of the circulating volume sits in the venous system. Vasodilatation from sepsis, anaesthetic induction, propofol, opioids and vasodilators pools blood peripherally and reduces venous return without any fluid having been lost.
Intrathoracic pressure — positive pressure ventilation and PEEP raise intrathoracic pressure, reducing the gradient for venous return. This is why blood pressure so often falls at induction and intubation.
Intra-abdominal pressure — raised intra-abdominal pressure, abdominal compartment syndrome and laparoscopic insufflation all impede venous return through the inferior vena cava.
Rhythm — atrial contraction contributes the final 20 to 30% of ventricular filling. Losing it in atrial fibrillation or ventricular pacing reduces preload, and matters most in a stiff ventricle. See Heart Valves.
Heart rate — tachycardia shortens diastole, so there is less time to fill. Above a certain rate, further increases in rate reduce cardiac output rather than raising it.
Ventricular compliance — a stiff, hypertrophied or ischaemic ventricle needs a higher filling pressure to achieve the same filling volume. This is the single biggest reason pressure is a poor proxy for volume.
Obstruction to filling — cardiac tamponade, tension pneumothorax and massive pulmonary embolism all limit filling regardless of circulating volume. In these situations fluid is a holding measure at best; the obstruction must be relieved.
7. The family of curves: how the curve moves
There is not one Frank–Starling curve but a family of them. Changing contractility or afterload shifts the whole curve.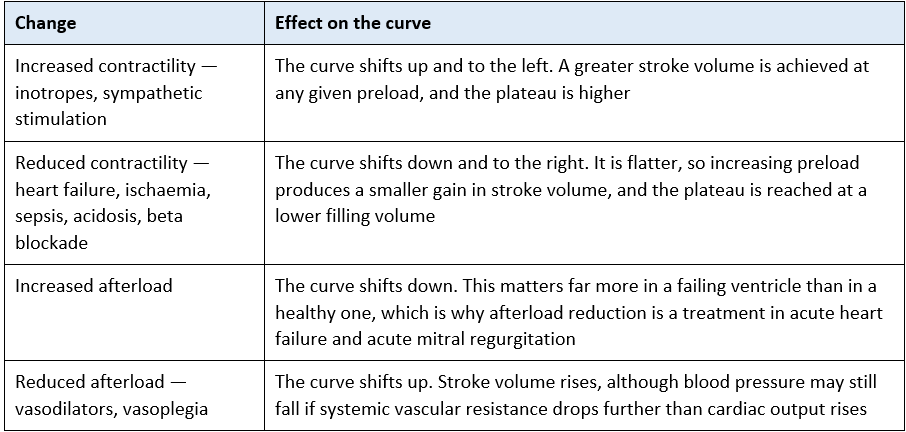
This is the whole logic of haemodynamic support
If the patient is on the steep part of their curve, give fluid — you move them along the curve.
If they are on the flat part and the curve is low, fluid will not help. You need to move the curve itself: an inotrope to raise it, or afterload reduction to unload the ventricle.
If blood pressure is low but cardiac output is adequate, the problem is systemic vascular resistance, and a vasopressor is the logical answer rather than either of the above.
Being able to state which of those three situations your patient is in, and why, is precisely what a Step 2 assessor is looking for. See Cardiogenic Shock and Common Cardiac Drugs.
8. Fluid responsiveness: where is my patient on the curve?
Step 2 content — rationale and application
Fluid responsiveness means that a fluid bolus will produce a meaningful rise in stroke volume — conventionally 10 to 15%. It is another way of saying that the patient is on the steep part of their curve. Only around half of haemodynamically unstable critical care patients are fluid responsive at any given moment, which means that giving fluid on assumption is wrong roughly half the time.
8.1 Ways of assessing it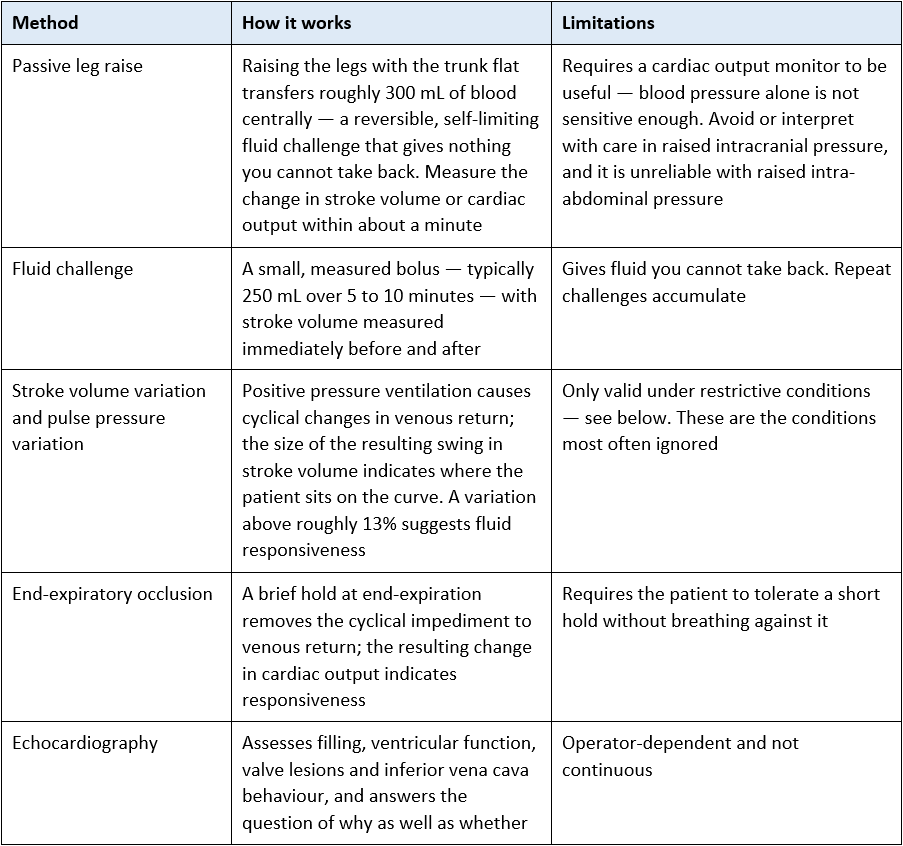
When stroke volume and pulse pressure variation are NOT valid
These require: sinus rhythm; fully controlled mechanical ventilation with no spontaneous respiratory effort; a tidal volume of at least around 8 mL/kg; a closed chest; and normal intra-abdominal pressure.
They are therefore unreliable in atrial fibrillation and frequent ectopy, in any spontaneously breathing or triggering patient, on lung-protective low tidal volumes, after cardiac surgery with an open chest, in right ventricular failure, and in abdominal compartment syndrome.
Since a great many critical care patients fall into at least one of those categories, this is where the passive leg raise earns its place — it remains valid in arrhythmia and in the spontaneously breathing patient.
If a number appears on the monitor, that does not mean the conditions for interpreting it have been met. Knowing when not to trust a number is a Step 2 skill.
8.2 The distinction that matters most
Being fluid responsive is not the same as needing fluid. A healthy person is fluid responsive; that does not mean they need a litre of Hartmann’s. The question is whether increasing the cardiac output would actually benefit this patient — whether there is evidence of inadequate perfusion in the form of a rising lactate, falling urine output, poor capillary refill, a widening peripheral temperature gradient or altered mental state.
Fluid overload is itself harmful. A cumulative positive balance is consistently associated with worse outcomes — pulmonary oedema, prolonged ventilation, impaired wound and anastomotic healing, gut oedema, raised intra-abdominal pressure and worsening kidney injury. Once the patient is stabilised, the direction of travel should be reviewed, and de-escalation of fluid considered. See Fluid Management – Colloid v Crystalloid and Monitoring Fluid Status.
9. Why CVP is a poor measure of preload
Step 2 content — rationale and application
Preload is a volume. CVP is a pressure. The relationship between the two depends entirely on ventricular compliance — and compliance varies enormously between patients and within the same patient over hours.
A stiff, hypertrophied ventricle may have a CVP of 14 while being underfilled.
A dilated, compliant ventricle may have a CVP of 4 while being adequately filled.
Positive pressure ventilation and PEEP raise the measured CVP without changing the volume in the ventricle.
Tricuspid regurgitation, raised intra-abdominal pressure and tamponade all raise CVP independently of filling.
A transducer levelled incorrectly changes the number by several mmHg — see Arterial Line Transducer.
The evidence is consistent: a single CVP value is a poor predictor of whether a patient will respond to fluid. That does not make it useless. Its value lies in the trend, in the response to an intervention, in the waveform, and as a safety signal — a CVP that is high and rising in a patient who is not improving is telling you something important, usually about the right ventricle. Use it as one piece of a picture that also includes stroke volume, lactate, urine output, examination and echocardiography.
See Invasive Monitoring – Waveforms and Cardiac Output Monitoring.
10. The right ventricle and ventricular interdependence
Step 2 content — rationale and application
Starling’s law applies to both ventricles, and the balance between them is one of its most important functions — it is what prevents blood pooling in either the systemic or the pulmonary circulation. But the right ventricle behaves differently from the left.
It is thin-walled and far more sensitive to afterload. Anything that raises pulmonary vascular resistance — hypoxia, hypercapnia, acidosis, high PEEP, overdistension, pulmonary embolism, ARDS — impairs it disproportionately.
It is preload-dependent, but only up to a point, and that point comes early in right ventricular failure.
Why more fluid can lower cardiac output
The two ventricles share the interventricular septum and sit within the same non-compliant pericardium. This is ventricular interdependence.
Over-filling a failing right ventricle distends it further. The septum bows towards the left ventricle, reducing left ventricular filling. Annular dilatation worsens tricuspid regurgitation, so even less blood moves forward.
The result is that a fluid bolus lowers the cardiac output rather than raising it — a genuinely counterintuitive finding, and one of the clearest examples of why Starling’s law must be applied to the specific patient rather than as a general rule.
In right ventricular failure the priorities are correcting the drivers of pulmonary vascular resistance, careful and incremental filling, and early escalation. See Cor Pulmonale and Pulmonary Embolism.
11. Clinical scenarios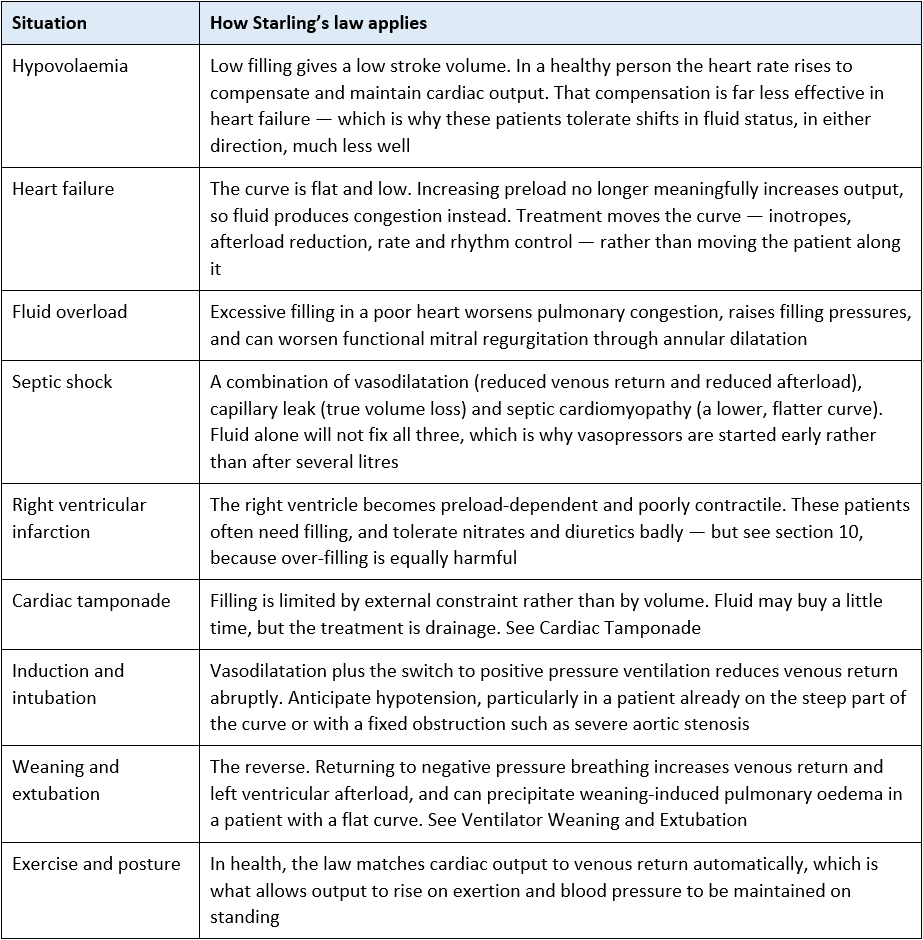
12. Clinical implications for the acute care nurse
Before giving fluid
Ask what you are trying to achieve, and what you will measure to tell whether it worked. “The blood pressure was low” is a reason to assess, not a plan.
Give small measured aliquots — typically 250 mL — and reassess after each, rather than prescribing a litre and reviewing at the end of it.
Reassess against a response, not against a target number: stroke volume or cardiac output where available, plus lactate, urine output, capillary refill, peripheral temperature gradient and conscious level.
Consider a passive leg raise where a cardiac output monitor is in use — it costs nothing and can be undone.
Through the shift
Track the cumulative fluid balance, not just today’s. A patient can be four litres positive over a week without any single day looking remarkable.
Level and zero transducers, and treat an unexpected CVP change as a reason to check the transducer before changing the treatment.
Know whether the conditions for interpreting stroke volume variation are actually met in your patient before quoting the number on a ward round.
Protect rhythm and rate — both are preload determinants, not just monitoring findings.
Escalate for:
A patient who has stopped responding to fluid — repeated boluses with no rise in stroke volume mean the curve is flat, and the plan needs to change rather than repeat.
A rising CVP with a falling cardiac output — think right ventricular failure, tamponade or obstruction.
Deterioration after a fluid bolus, particularly in known right ventricular failure or pulmonary hypertension.
New or worsening pulmonary oedema particularly during weaning or after extubation.
13. Self-test
Test your understanding. The section to check your answer against is shown in brackets.
Step 1
– State Starling’s law in your own words, and describe the mechanism behind it. (Sections 2 and 3)
– Sketch the Frank–Starling curve. Mark where a hypovolaemic patient sits and where a fluid-overloaded patient in heart failure sits. (Section 4)
– Define preload, afterload and contractility, and give one thing that increases and one that decreases each. (Section 5)
– Write the equations linking heart rate, stroke volume, cardiac output, systemic vascular resistance and mean arterial pressure. (Section 3)
– List six things that reduce preload in a ventilated critically ill patient. (Section 6)
– Why does a patient with heart failure tolerate both dehydration and fluid overload less well than a healthy person? (Sections 7 and 11)
– Your patient’s blood pressure falls immediately after intubation. Explain why, using preload. (Sections 6 and 11)
Step 2
– What does fluid responsiveness mean, and how would you assess it in a patient who is in atrial fibrillation and triggering the ventilator? (Section 8)
– List the conditions required for stroke volume variation to be valid. How many of your current patients meet all of them? (Section 8.1)
– A colleague says the CVP is 4 so the patient needs fluid. Give a fuller answer. (Section 9)
– Explain how giving fluid can reduce cardiac output in right ventricular failure. (Section 10)
– Your patient has had three 500 mL boluses with no change in stroke volume, lactate or urine output. What has this told you, and what would you suggest to the team? (Sections 7 and 8)
– Distinguish between a patient who is fluid responsive and a patient who needs fluid, with an example of each. (Section 8.2)
– Why are vasopressors started early in septic shock rather than after several litres of fluid? (Sections 7 and 11)
Abbreviations
ARDS – Acute respiratory distress syndrome
CC3N – Critical Care Networks – National Nurse Leads
CO / CI – Cardiac output / cardiac index
CVP – Central venous pressure
EDV – End-diastolic volume
MAP- Mean arterial pressure
PEEP- Positive end-expiratory pressure
PLR – Passive leg raise
PPV – Pulse pressure variation
PVR / SVR – Pulmonary / systemic vascular resistance
SV / SVI – Stroke volume / stroke volume index
SVV – Stroke volume variation
Glossary
Compliance — the change in volume produced by a given change in pressure. A stiff ventricle has low compliance.
End-diastolic volume — the volume in the ventricle immediately before contraction; the true measure of preload.
Fluid responsiveness — a rise in stroke volume of roughly 10 to 15% following a fluid challenge.
Length-dependent activation — the increase in myofilament calcium sensitivity that occurs when the sarcomere is stretched; the principal mechanism behind Starling’s law.
Lusitropy — the rate of myocardial relaxation, which determines how well the ventricle fills.
Venous return — the volume of blood returning to the right atrium per minute; over time it must equal cardiac output.
Ventricular interdependence — the mechanical interaction between the ventricles through the shared septum and pericardium.
Recommended pages
Next in this section
The Cardiac Cycle — where filling and ejection sit in time
Cardiac Action Potential — excitation–contraction coupling and the calcium side of contractility
Heart Valves — the atrial kick, and lesion-specific loading targets
Structure and Function of the Heart
Applying this clinically
Cardiac Output Monitoring; Cardiac Output Studies – reference range and examples
Invasive Monitoring – Waveforms – Art, CVP, PA, PCWP; Arterial Line Transducer
Fluid Management – Colloid v Crystalloid; Monitoring Fluid Status, Balance and Renal Function
Cardiogenic Shock; Pathophysiology of Heart Failure; Left Ventricular Failure
Common Cardiac Drugs — inotropes, vasopressors and vasodilators
Cardiac Tamponade; Cor Pulmonale; Pulmonary Embolism
Ventilator Weaning and Extubation – Overview; Basic Modes of Ventilation
Further reading and local governance
Guidelines
NICE CG174 — Intravenous fluid therapy in adults in hospital.
Surviving Sepsis Campaign — international guidelines for the management of sepsis and septic shock.
ESICM consensus and guidance on haemodynamic monitoring and fluid responsiveness assessment in the critically ill.
Faculty of Intensive Care Medicine / Intensive Care Society — Guidelines for the Provision of Intensive Care Services (GPICS).
CC3N National Competency Framework for Registered Nurses in Adult Critical Care — Step 1 and Step 2
Local governance
Your local fluid resuscitation and maintenance fluid policy, including bolus volumes and reassessment intervals.
Your local guidance on cardiac output monitoring — which device, when it is indicated and who may interpret it.
Your local vasopressor and inotrope prescribing policy, and the limits within which you may titrate.
Your local fluid balance and de-escalation documentation standards.
Textbooks
Levick, An Introduction to Cardiovascular Physiology
Adam, Osborne and Welch, Critical Care Nursing: Science and Practice (Oxford)
Bersten and Handy, Oh’s Intensive Care Manual
Last reviewed: July 2026. Next review due: July 2027. AskAlth Team, London UK.
AskAlth is an educational resource for registered healthcare professionals in UK adult critical care. Not for patients or the public. Not a substitute for local policy, clinical guidance or the BNF. Content reflects guidance at the time of writing. AskAlth is independent and not affiliated with CC3N, NICE, the Resuscitation Council UK, the NMC or the NHS.
AskAlth is an independent educational resource created by NHS critical care nurses. It is not affiliated with CC3N, NICE, or the NHS, though our content is mapped to and referenced against their published frameworks and guidance.