

12 lead ECG Essentials
Part 1 – Step 1
An ECG records the heart’s electrical activity over time using electrodes placed on the skin.
It provides information about:
Heart rate
Heart rhythm
Conduction abnormalities
Chamber enlargement
Evidence of cardiac ischaemia or infarction
Normal Values for quick reference: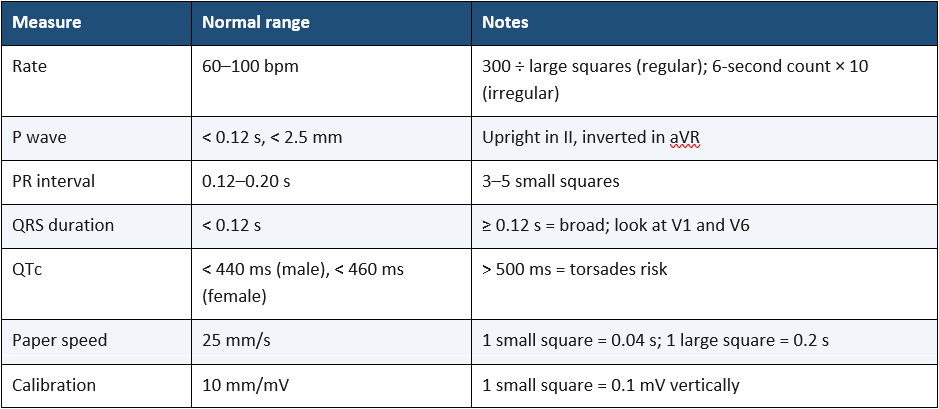
Standard ECG setup
12 leads: 6 limb leads (I, II, III, aVR, aVL, aVF) + 6 chest leads (V1–V6)
Paper speed: 25 mm/second
1 small box on standard ECG paper at this speed = 0.04 sec, 1 large box = 0.2 sec

Stepwise ECG Interpretation
Being Systematic Helps: Rate, Rhythm, Axis, Intervals, ST-T, Morphology 
Rate – to assess the rate
If Regular rhythm: 300 divided by the number of large boxes between R waves (in the example above this would be 300/4 = 75 bpm (heart rate).
If Irregular rhythm: Count R waves in 6 seconds (30 large squares from the first R wave (this represents 6 seconds at a speed of 25mm/second) × 10 (note: a rhythm strip over a longer time period may be required to calculate this accurately)
Rhythm – to assess the rhythm:
Is it Regular or irregular?
Is there a P wave before every QRS?
Is the PR interval consistent?
Axis (ICU Step 2)
The axis is the mean direction of ventricular depolarisation. The quickest bedside method is to look at leads I and aVF: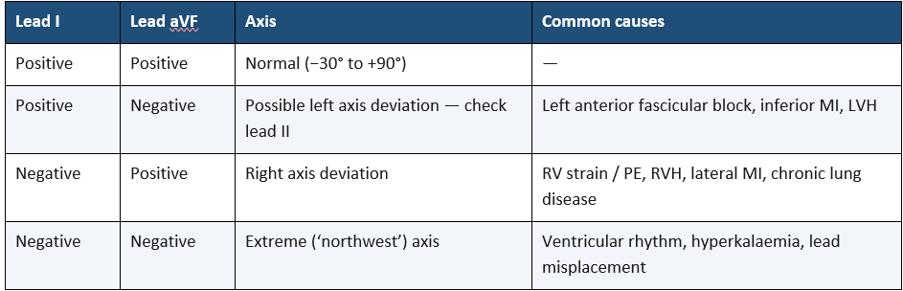
P waves (Atrial depolarisation)
Normal: upright in II, inverted in aVR
Absent → consider AFib or junctional rhythm
Sawtooth pattern → Atrial flutter
PR interval (atrial to ventricular delay)
Measure the start of the P wave to the start of the QRS complex
Normal: 0.12–0.20 sec (3 to 5 small squares)
Prolonged → 1° AV block
Variable → Mobitz I or II
QRS complex (ventricular depolarisation)
Normal: <0.12 sec (less than 3 small squares)
Wide → bundle branch block, ventricular rhythm, or WPW (wolff parkinson white syndrome)
ST segment (early ventricular repolarisation) and T wave (ventricular repolarisation)
ST elevation/depression → ischaemia/infarction
T wave inversion → ischemia or strain
Peaked T → indicates hyperkalaemia (check bloods urgently)
QT interval (beginning to the end of ventricular contraction and relaxation)
(Corrected for rate)
QTc (c- corrected interval) = QT (measure from start of Q(RS) to end of T wave / √RR (square root of R-R interval))
Threshold for acceptable values: QTc less than 440 ms (men) or less than 460 ms (women) – 450 is often quoted in clinical practice (and don’t worry the ECG machine calculates this for you!)
Risk of torsades de pointes (polymorphic VT) if greater than 500 ms
Common ECG Rhythms and Recognition:

Practice and Tools
To master ECG rhythm recognition:
Practice….
Regularly review rhythm strips and real patient ECGs
Always correlate the ECG with patient symptoms
Part 2 —
Step 2 Level: Interpretation in the Critically Ill Patient
Step 2 competencies are undertaken alongside a post-registration academic critical care programme and build on the Step 1 foundation. At this level you are expected to interpret the 12-lead in the context of the patient’s haemodynamics, therapies and comorbidities, and to anticipate deterioration rather than react to it.
2.1 Cardiac axis
The axis is the mean direction of ventricular depolarisation. The quickest bedside method is to look at leads I and aVF:
2.2 Conduction disease
AV block
First-degree: PR > 0.20 s, constant, every P conducts. Usually benign
Mobitz I (Wenckebach): PR lengthens progressively until a beat drops. Usually AV nodal; often responds to atropine
Mobitz II: constant PR with intermittent non-conducted P waves. Infranodal, unpredictable, high risk of progression — escalate for pacing
Third-degree (complete): AV dissociation with an escape rhythm. A narrow escape is junctional and relatively stable; a broad escape is ventricular, slow and unreliable
Bundle branch block
Requires QRS ≥ 0.12 s. Look at V1 and V6
RBBB: RSR′ (‘M’ pattern) in V1, broad slurred S wave in V6 — MaRRoW
LBBB: broad or QS complex in V1, broad notched R in V6 — WiLLiaM
New LBBB with ischaemic symptoms is treated as an acute coronary syndrome until proven otherwise
ST and T changes are expected (discordant) in BBB and cannot be read at face value — see Sgarbossa criteria in 2.4
2.3 The QT interval and torsades risk
Measure the QT from the start of the QRS complex to the end of the T wave, in the lead where the T wave ends latest (usually II or V5). Measuring to the start of the T wave is a frequent error and systematically under-reports the interval.
Bazett correction: QTc = QT ÷ √RR, where RR is the R–R interval in seconds. Bazett over-corrects at fast rates and under-corrects at slow rates; Fridericia (QT ÷ ³√RR) is more reliable at the extremes.
Upper limit of normal: approximately 440 ms in men, 460 ms in women
QTc > 500 ms carries a materially increased risk of torsades de pointes
Critical care is a QT-prolonging environment with drugs contributing to prolongation:
amiodarone, sotalol, haloperidol, quetiapine, ondansetron, macrolides, quinolones, methadone and azole antifungals — often several concurrently
Correct potassium, magnesium and calcium; hypokalaemia and hypomagnesaemia amplify drug-induced prolongation
2.4 Ischaemia and infarction
Anatomical territories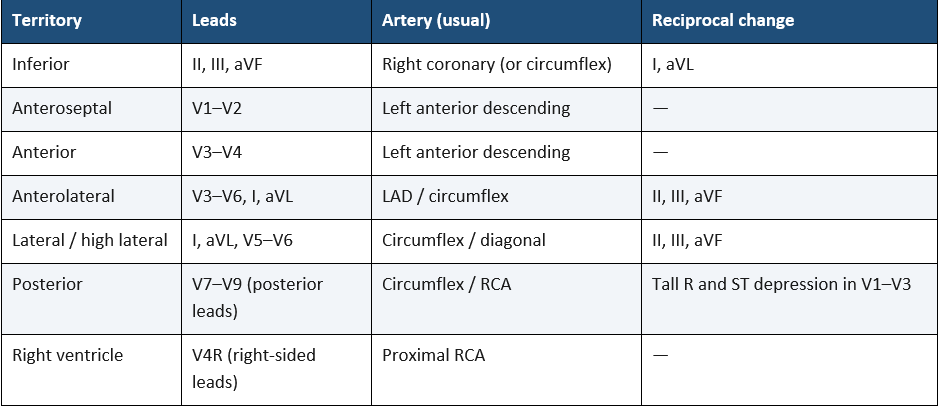
Recognising acute injury
ST elevation is measured at the J point relative to the TP segment, in two or more contiguous leads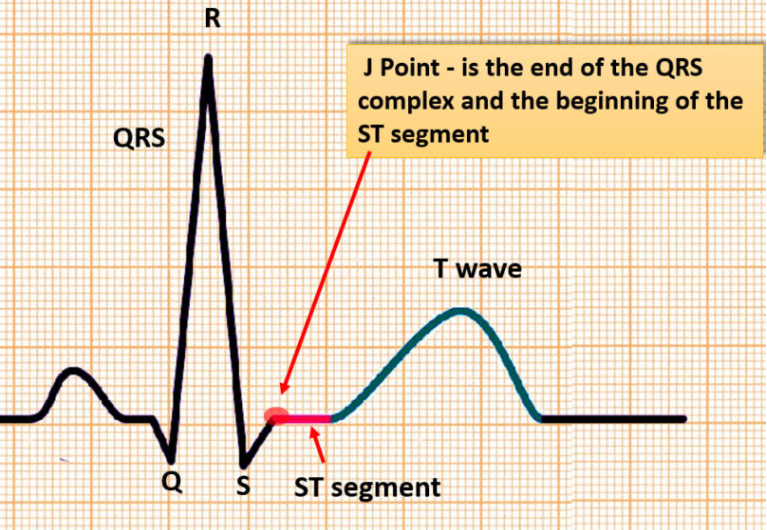
Conventional thresholds: ≥ 1 mm in limb leads; ≥ 2 mm in V2–V3 for men (≥ 1.5 mm for women); ≥ 1 mm in other chest leads
ST depression and T wave inversion suggest ischaemia or strain rather than transmural injury — but widespread ST depression with ST elevation in aVR suggests left main or severe three-vessel disease
Hyperacute, broad, symmetrical T waves may be the earliest change, preceding ST elevation
Pathological Q waves (> 0.04 s, or > 25% of the R wave height) indicate established infarction
Wellens’ pattern — deeply inverted or biphasic T waves in V2–V3 in a pain-free patient — indicates critical proximal LAD stenosis
In inferior STEMI, record right-sided leads: RV infarction makes the patient preload-dependent and profoundly hypotensive with nitrates
Sgarbossa criteria allow infarction to be identified despite LBBB or ventricular pacing: concordant ST elevation ≥ 1 mm, concordant ST depression ≥ 1 mm in V1–V3, or excessively discordant ST elevation
The ECG is a moving picture
A single normal ECG does not exclude acute coronary syndrome. Serial ECGs and comparison with previous traces are what reveal evolution — repeat with every change in pain or haemodynamics.
2.5 Electrolyte and metabolic changes
Disturbance
ECG features
Hyperkalaemia
Progressive: tall peaked T waves → flattened or absent P waves and PR prolongation → QRS widening → sine wave → asystole or VF
Hypokalaemia
Flattened T waves, ST depression, prominent U waves, apparent QT prolongation, increased ectopy and torsades risk
Hypocalcaemia
QT prolongation through ST segment lengthening, with a normal T wave
Hypercalcaemia
QT shortening; occasionally Osborn (J) waves
Hypomagnesaemia
QT prolongation and torsades; frequently coexists with hypokalaemia
Hypothermia
Bradycardia, Osborn (J) waves, prolonged intervals, tremor artefact, VF risk
Hyperkalaemia is the change to act on fastest. Peaked T waves in a patient with acute kidney injury, rhabdomyolysis, crush injury, massive transfusion, or on potassium-sparing drugs warrant an immediate blood gas potassium and escalation — do not wait for the laboratory result.
2.6 Chamber enlargement and strain
Left atrial enlargement (P mitrale): broad, bifid P wave in lead II
Right atrial enlargement (P pulmonale): tall, peaked P wave in lead II
LVH (Sokolow–Lyon): S in V1 plus R in V5 or V6 ≥ 35 mm, often with lateral ST depression and T inversion (‘strain’)
RVH: dominant R wave in V1, right axis deviation, right-sided T inversion
Acute RV strain, e.g. pulmonary embolism: sinus tachycardia is most common; also new RBBB, right axis deviation, T inversion in V1–V4, and the classic but uncommon S1Q3T3 pattern
2.7 Other patterns relevant to critical care
Pacing: sharp vertical spikes preceding a paced complex; ventricular pacing gives an LBBB-like broad QRS. Recognise failure to capture, failure to sense and oversensing
WPW: short PR with a slurred delta wave and broad QRS; avoid AV nodal blocking drugs in pre-excited AF
Brugada: coved ST elevation in V1–V2 with T inversion; may be unmasked by fever or sodium channel blockers
Pericarditis: widespread concave (‘saddle-shaped’) ST elevation with PR depression, and PR elevation in aVR
Digoxin effect: downsloping ‘reverse tick’ ST depression. Toxicity causes almost any arrhythmia, classically atrial tachycardia with block
Takotsubo and neurogenic changes (e.g. subarachnoid haemorrhage): deep widespread T inversion with marked QT prolongation, often without coronary occlusion
2.8 Linking the ECG to the patient
Correlate every ECG with the arterial trace, cardiac output data, filling status and vasoactive support
Ask what the rhythm is costing the patient: loss of atrial kick in AF can reduce cardiac output by 20–30% in a stiff or hypovolaemic ventricle
Consider therapies in progress — inotropes, vasopressors, sedation, renal replacement (potassium shifts), targeted temperature management — all change the trace
Document what you saw, what you did, who you escalated to, and when
References and Further Reading:
Resuscitation Council UK — Adult Advanced Life Support Guidelines, including the tachycardia and bradycardia algorithms (resus.org.uk)
Society for Cardiological Science and Technology — Clinical Guidelines for Recording a Standard 12-Lead ECG (scst.org.uk). The definitive UK reference on electrode placement and recording technique
NICE NG185 — Acute coronary syndromes
NICE NG196 — Atrial fibrillation: diagnosis and management
UK Kidney Association — Clinical Practice Guideline: Treatment of Acute Hyperkalaemia in Adults
European Society of Cardiology — Guidelines on acute coronary syndromes, and on ventricular arrhythmias and the prevention of sudden cardiac death
Thygesen K et al. Fourth Universal Definition of Myocardial Infarction (2018)
.Last Updated, July 2026, AskAlth Registered Nurses, London UK